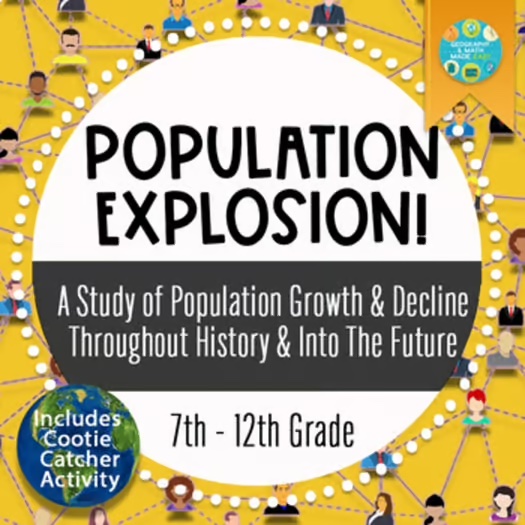
Understanding population trends may seem overwhelming at first, not only to the students but also to the instructor responsible for teaching it. As the instructor, breaking it down into simpler terms for younger learners (and even more mature learners) can make it much easier to grasp this concept. One way to do this is by first looking at birth rates and death rates within a given population, as well as factors like immigration and emigration, and exploring the ripple effects of these. What is important is that they, at the end of the lesson, understand the concept (the big picture idea) so they can apply it to other country studies. For younger learners, keep it simple and focus on one country’s population trends, or have your students explore a country of their choice, giving the student(s) learning autonomy.
I remember questioning myself as a young geography teacher, “How am I going to teach this concept and the entire world as well.” The answer is don’t! We want students to walk away with the ability to take big ideas and apply them to other areas of the world. If you teach the concept of population trends using only one country, the learner will be able to apply the same understanding and concept to other countries. By analyzing birth, death, and fertility rates, infant mortality rate, developing/developed, life expectancies, immigration and emigration, poverty lines, and more students can grasp the cause and effects of population trends. Let’s give them analytical skills!
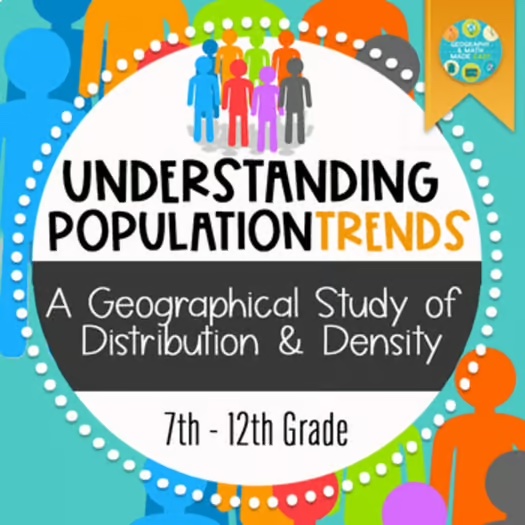
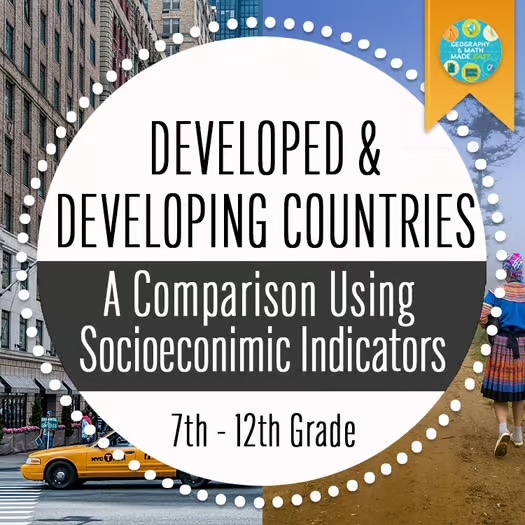
One lesson I use at the beginning of the year to look at the socioeconomic indicators of various countries is Developed Vs. Developing Countries (7th-12th). Socioeconomic indicators may seem like a big work, but by breaking it down and looking at the word blend can definitely help.
✅ Socio: Social/Society
✅ Economic: Production, distribution, and use of income, wealth, and commodities, resource of money.
✅ Indicators: A pointing or directing device, something that measures and records, “My grades indicate I have been studying”.
Once they have researched and gathered data, they analyze the information to determine if the county is a developed or developing country. Population trends can play into determining this or vica versa, the socialeconoimc indicators can lead to the trends in population. This gives student an big picture understanding of life expectancy, birth rates, death rate, infant mortality rate, population below poverty line, population growth rate, amongst other socioeconomic indicators.
By understanding the effects these population counts/trends have on people and resources, we can begin to see why populations are growing or declining. Channel this through the following topics:
🟢 Advancements in healthcare leading to lower death rates
🟢 Economic opportunities influencing migration patterns
🟢 Declining population in a certain region may lead to labor shortages and economic stagnation
🟢 A rapidly growing population could cause a shortage of resources (food, jobs, healthcare, housing, etc), and put strain on a city’s or town’s infrastructure.
🟢 Laws enforced limiting childbirth may not only lower the population making resources available to more families, but it could also cause fewer workers in the workforce to fill needed positions
Visual aids, like graphs or charts, can also help illustrate these trends in a more digestible format, which is why at G&M Made Easy we try to incorporate visuals into our lessons. Another teaching route you as an instructor can take to help younger learners understand the “ebb and flow” of population trends is focusing on specific regions or countries rather than analyzing global data all at once. This can make the information more manageable and relatable. Ultimately, by breaking down population trends into smaller pieces and considering the various factors at play, students can gain a clearer understanding of how and why populations change over time. Changes in population counts always have a ripple effect. Make it relatable!
Additionally, discuss how demographers studying the ups and downs of population counts can help us understand a government’s plan for the future by anticipating changes in infrastructure needs, healthcare services, educational resources, and roads.
Let’s take, for instance, population trends from the standpoint of the Department of Transportation. In the U.S. the department usually ends in “DOT:” TxDOT, TDOT, ArDOT, NYSDOT, etc. Beyond the U.S., names vary: Federal Ministry for Digital and Transport (Germany), Ministry of Transport (China, & Brazil), Department for Infrastructure and Transport (South Australia), etc. Look up your state’s/province’s/country’s Department of Transportation and teach population trends from the aspect of how the DOT has to analyze population trends. Students can relate more if you relate it to their personal lives and experiences.
The job/goal of these transportation departments is to study and maintain population trends in and out of regions and to maintain the transportation infrastructure. These departments have Transportation Planners who help develop plans and Transportation Engineers draw plans when adding roads, as well as highways, railway, and public transportation systems to meet the needs of the growing population. It also helps monitor and manage emission exposure due to vehicles on the roads. Discuss the purpose of the Department of Transportation. If you live in a large city such as DFW, New York, or Los Angeles, roads are being built, updated, and redirected regularly. Public transportation such as the Trinity Railway Express (TRE) in the DFW region is being expanded to reach more areas for commuters. This allows people to avoid heavy traffic moving into the city in the morning and out of the city in the evening. It’s ironic it is called rush hour traffic because you are not going or rushing anywhere in this traffic! The transportation department is responsible for encouraging and creating alternative ways for people to travel in and out of heavily trafficked areas and protect the environment from pollution created by traffic. Show students this video Top Ten Craziest Intersections: Engineering8 YouTube Channel, then discuss the reasons for these intersections and what could cause densely populated areas vs. sparsely populated areas.
Note: If the link breaks, simply type in the title in the YouTube search engine.
Here are some questions you can use to get younger learners thinking about how population trends have directly impacted their lives, making it relatable:
🔴 Do you remember a time when you walked into the grocery store only to find most of the products such as bread and milk purchased, leaving very little on the shelves? What caused this? How would population counts play into this situation?
🔴 Have you lived or do you know anyone who has lived in a rural area? Describe the housing in comparison to the city. What do you think the ripple effect would be in relation to housing, resources, education, and healthcare if people started moving to the area in vast numbers?
🔴 In 1949, under Leader Mao Zedong, the Chinese government encouraged all of their citizens to have lots of children and sent families to live in the rural areas and work the farms. The thinking was that it would strengthen China and make them more powerful. In 1979, China had such a large population—Over 1 billion people in China, almost the same size as the United States—that it had to find a way to control its population. Do you know what plan China came up with? Did it work? (One-Child Policy Act of 1979/80)
🔴 What would happen to your class sizes if there was an influx of people moving into your area/region?
Here are some resources to help you teach population trends and socioeconomic indicators:


MENTAL HEALTH TIPS FOR TEACHERS
As teachers, we are often overworked and pulled in too many directions. We often put others before ourselves, and learning to care for ourselves is hard. Addressing mental health is part of self-care for our minds, bodies, and souls. Remember, you can’t fill someone else’s cup if your cup is empty. Here are 27 FREE COUNSELING OPTIONS FOR TEACHERS https://www.weareteachers.com/free-counseling-for-teachers/ offering free online chats, buddy systems, peer-to-peer support communities, Employee Assistance Program (EPA) free counseling sessions, meditative art classes, and more.
FOLLOW US:
Follow us on our social media accounts and various teacher resources platforms. Simply click the icons below and follow or like us.
TEACHERS https://www.weareteachers.com/free-counseling-for-teachers/


#geographyandmathmadeeasy#teachertherapy#therapy#geography#middleschool#highschool
